




78%
of claims supported by a Skybridge report were accepted in full or in part.
Verifiable satellite report
Mark the place and date. Receive a technical satellite report to document your claim.
Where the evidence comes from
Weather satellites run by NOAA, NASA and EUMETSAT watch the continent without pause and archive every image. When you order a report, we go back to that archive — the same one weather services use — and read it over your property.
01NOAA · NASA
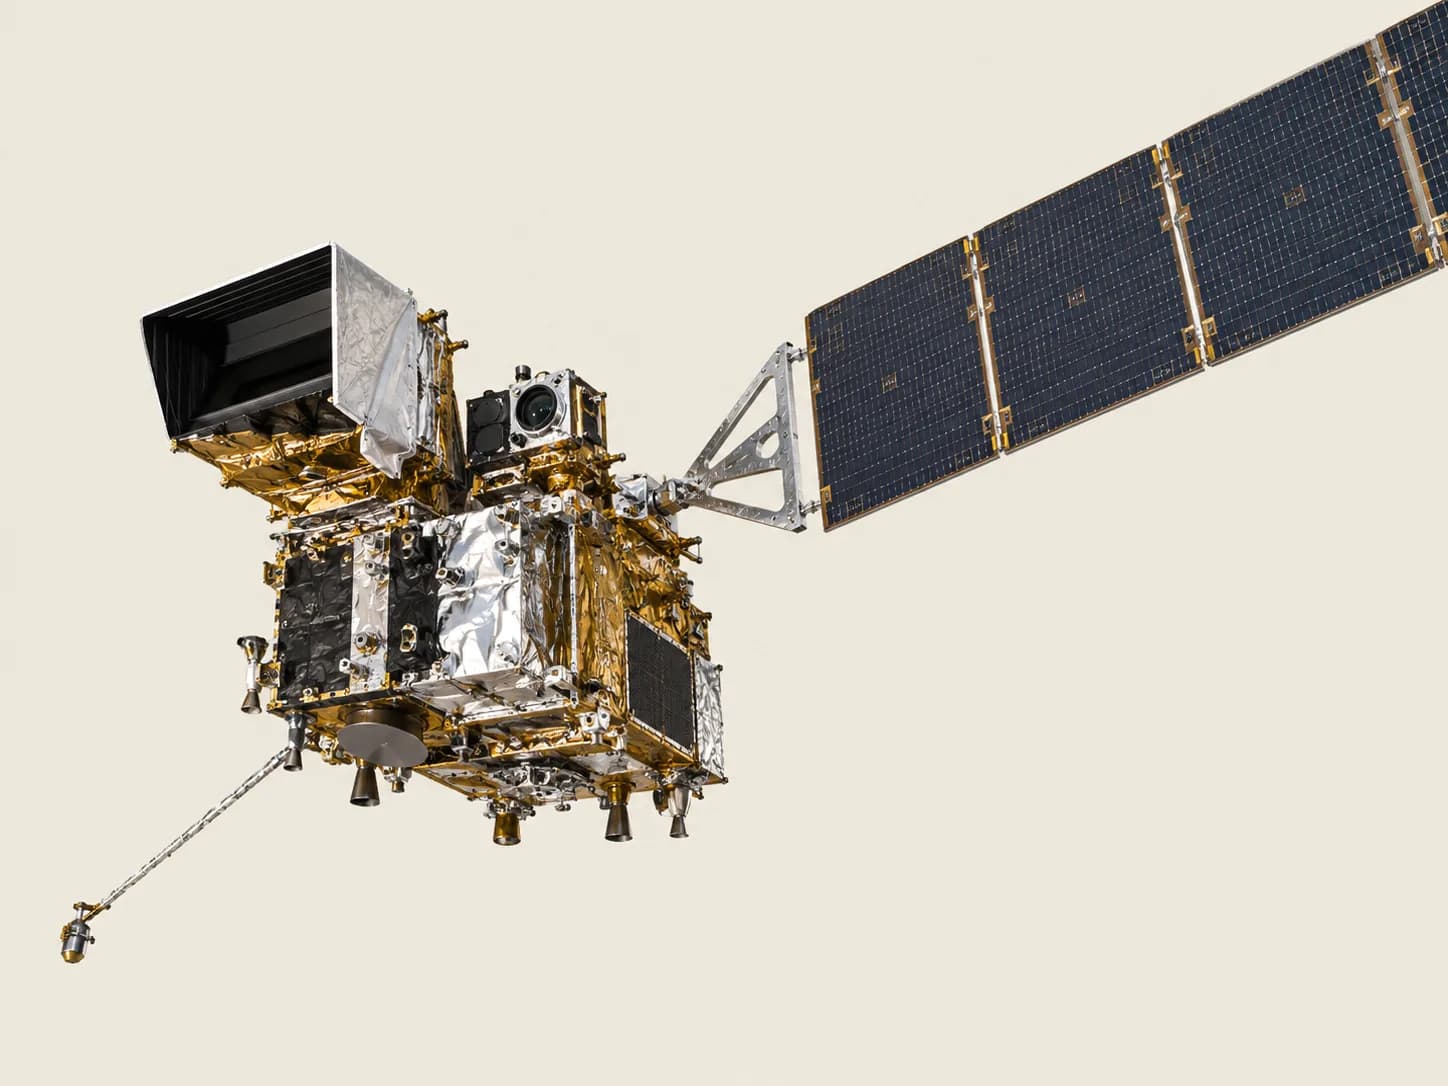
Parked over 75.2° W, it sees from Alaska to Tierra del Fuego. Its ABI imager sweeps the full disk every 10 minutes in 16 bands. Band 13 measures cloud-top temperature: the colder the top, the taller and more violent the storm.
02NOAA · NASA
Over 137.2° W it covers western North America and the Pacific. For a property west of 106° W we read this satellite: it looks at it more squarely, with less distortion.
03EUMETSAT · ESA
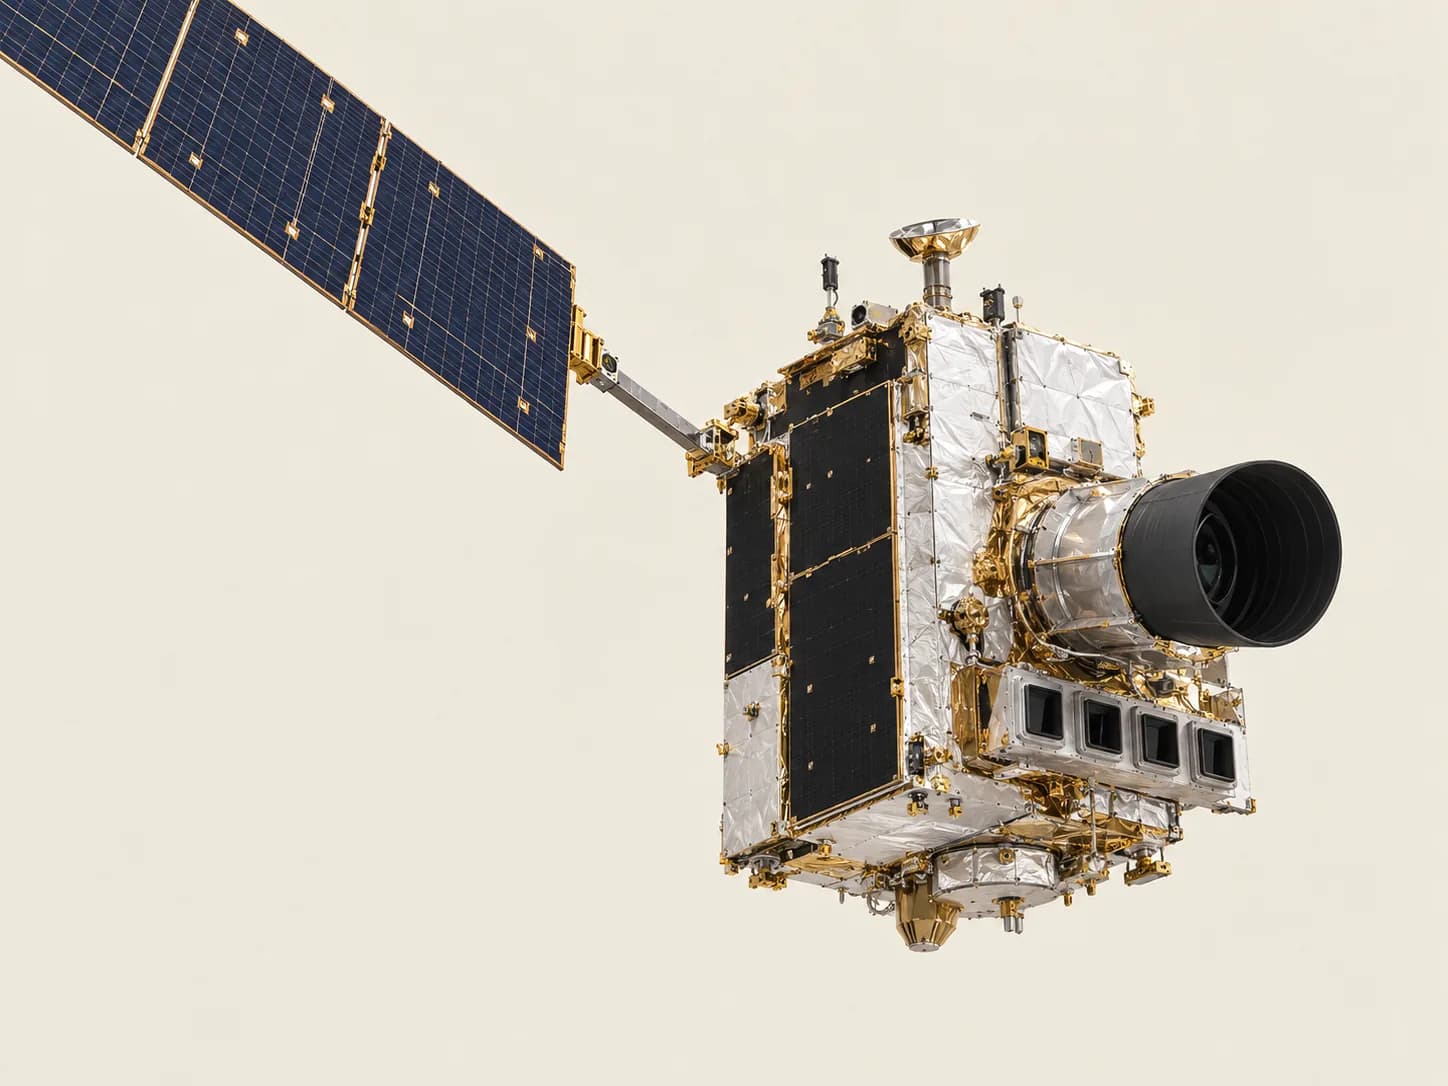
The first of Meteosat’s third generation, over the Greenwich meridian. Its FCI imager covers Europe every 10 minutes in 16 channels; we read it with the same method, tuned to the height of the local tropopause.
04Lightning
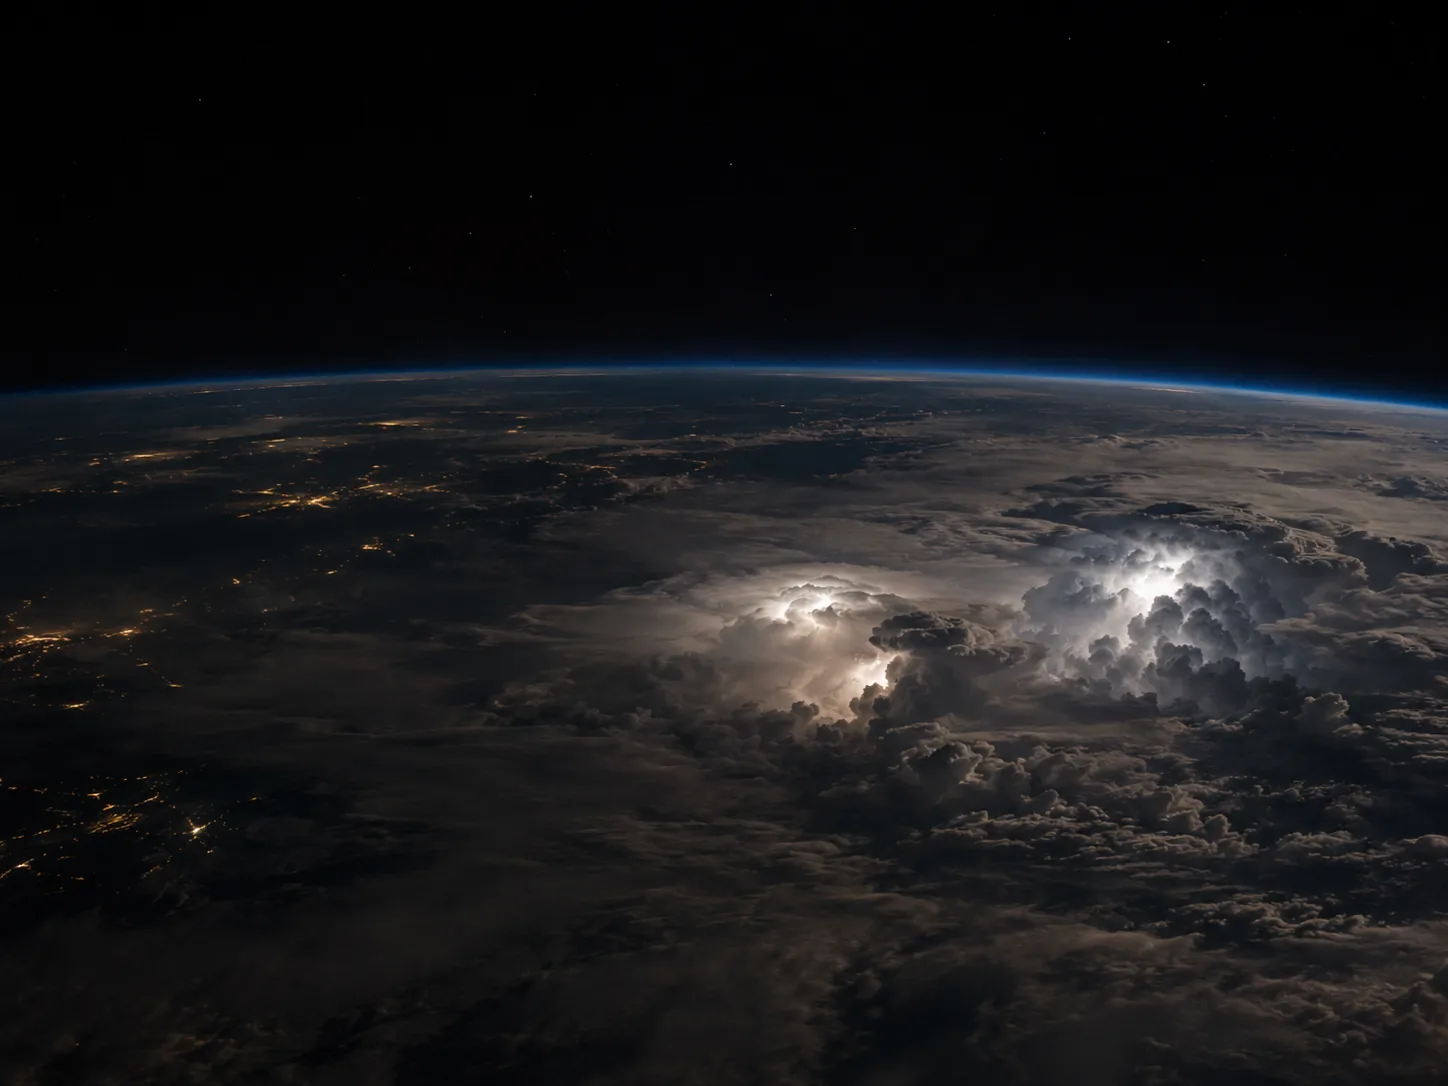
Cameras that film the planet hundreds of times a second and record every flash, day and night, even inside the cloud. We measure each flash’s distance to your property; a sudden jump in the rate often comes before hail.
05On the ground
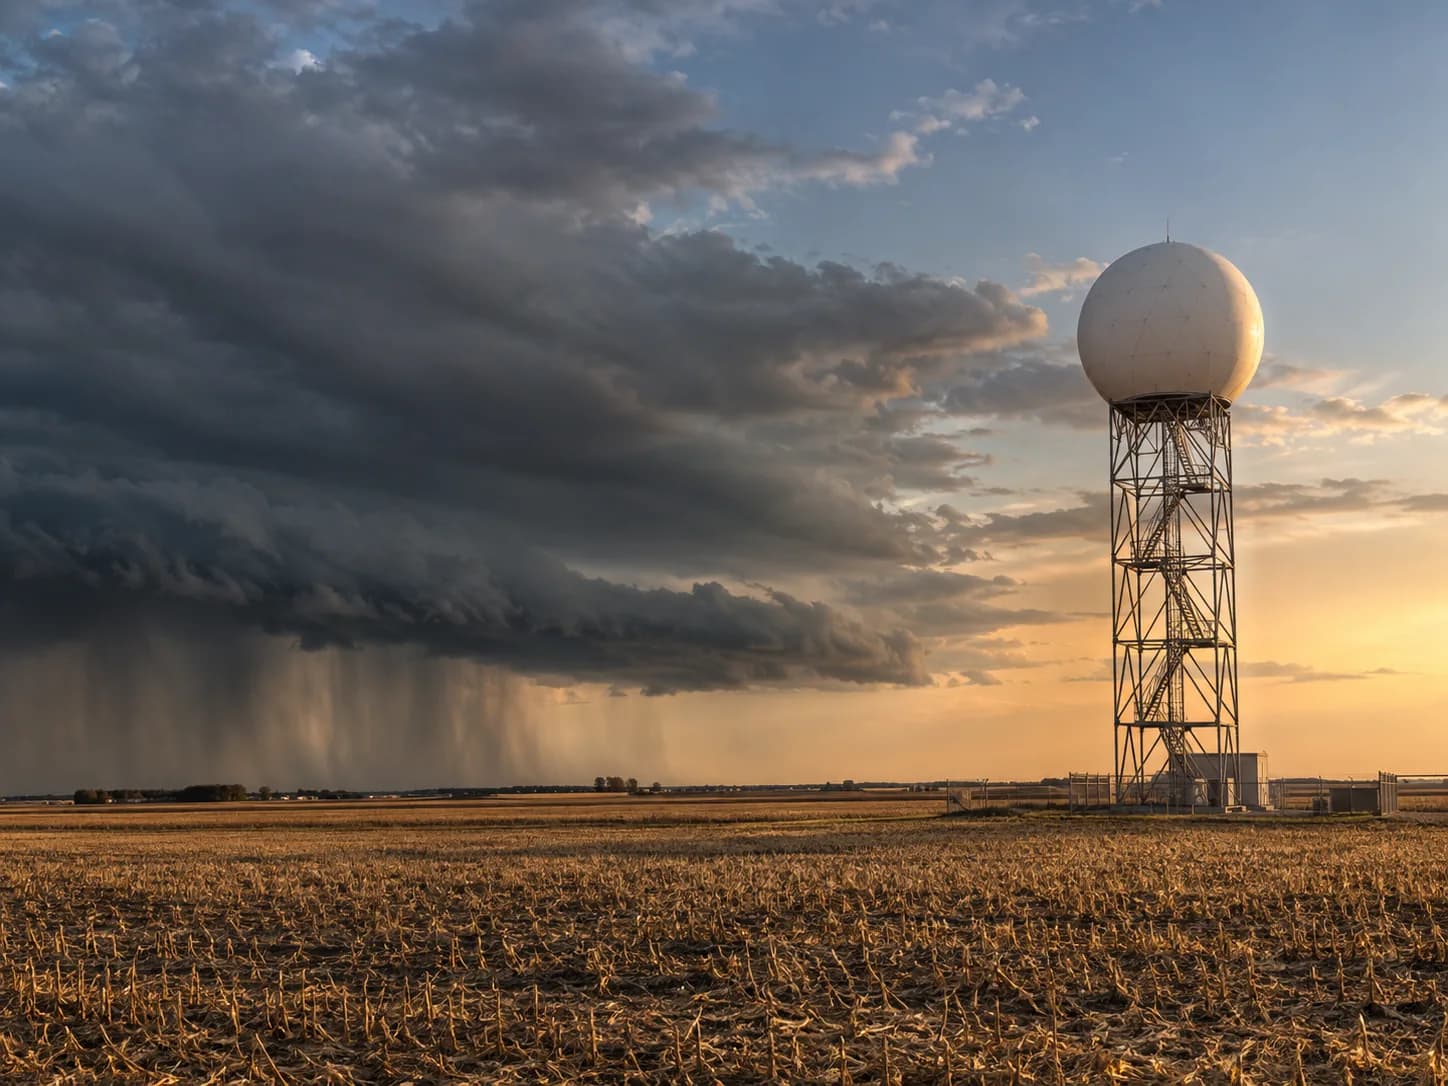
The satellite sees the cloud; the ground completes the story. In the United States we add MRMS radar, which estimates hail size, and SPC storm reports. Everywhere, wind from the GFS model — a model, never an observation — and Sentinel-2 to see the field before and after.
06Your report
Every layer is projected onto the same frame and carries its source, date and time burned in. This is how the real case of Kankakee, IL, United States is built:
A real case
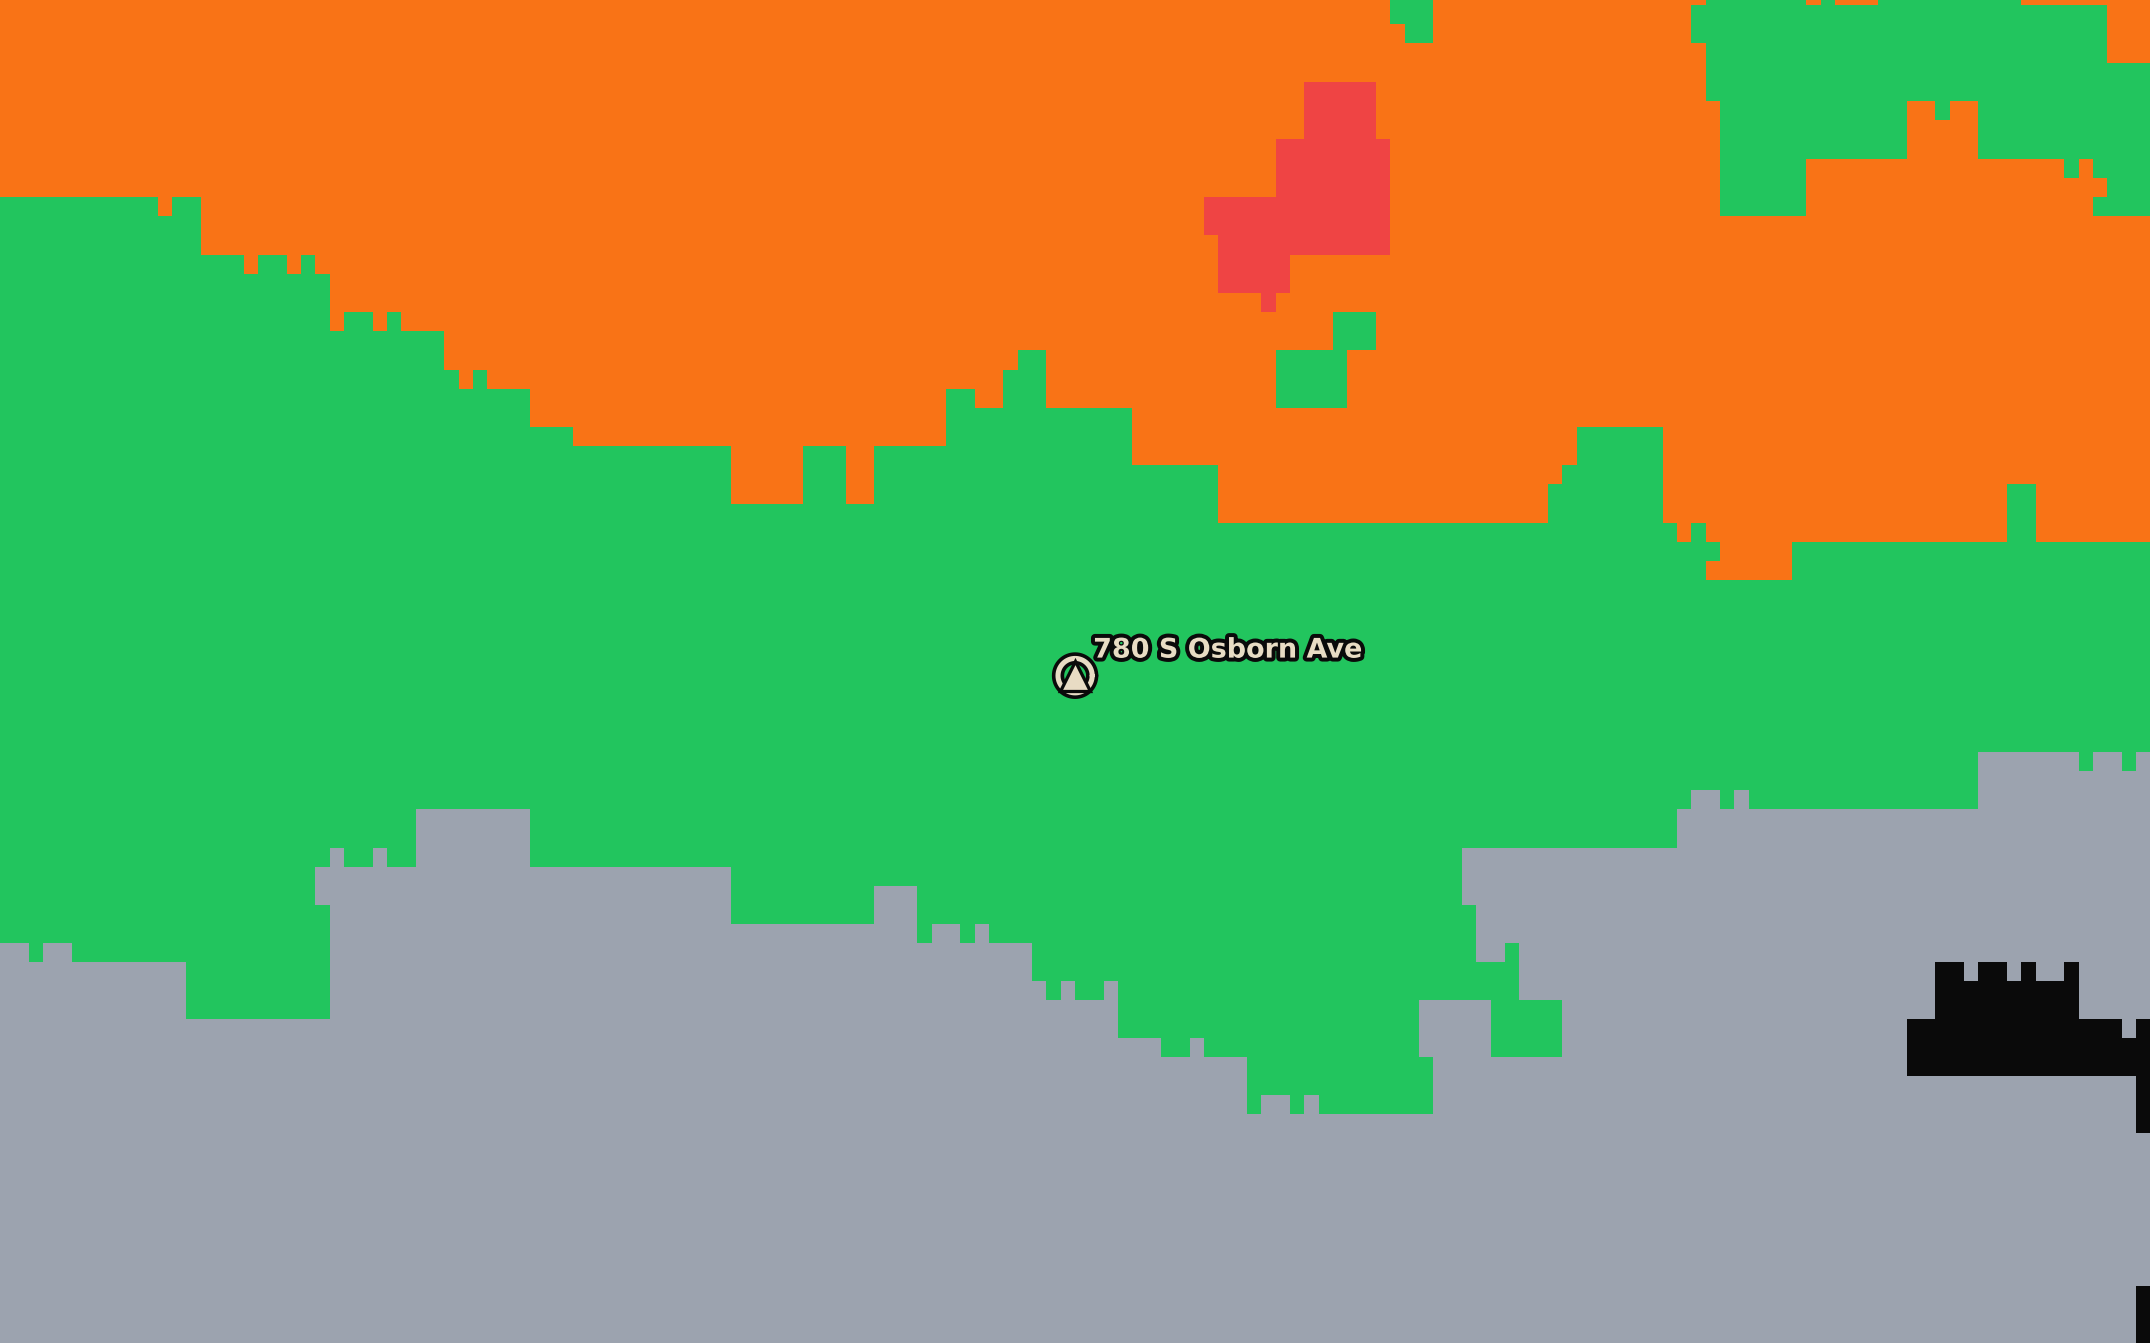
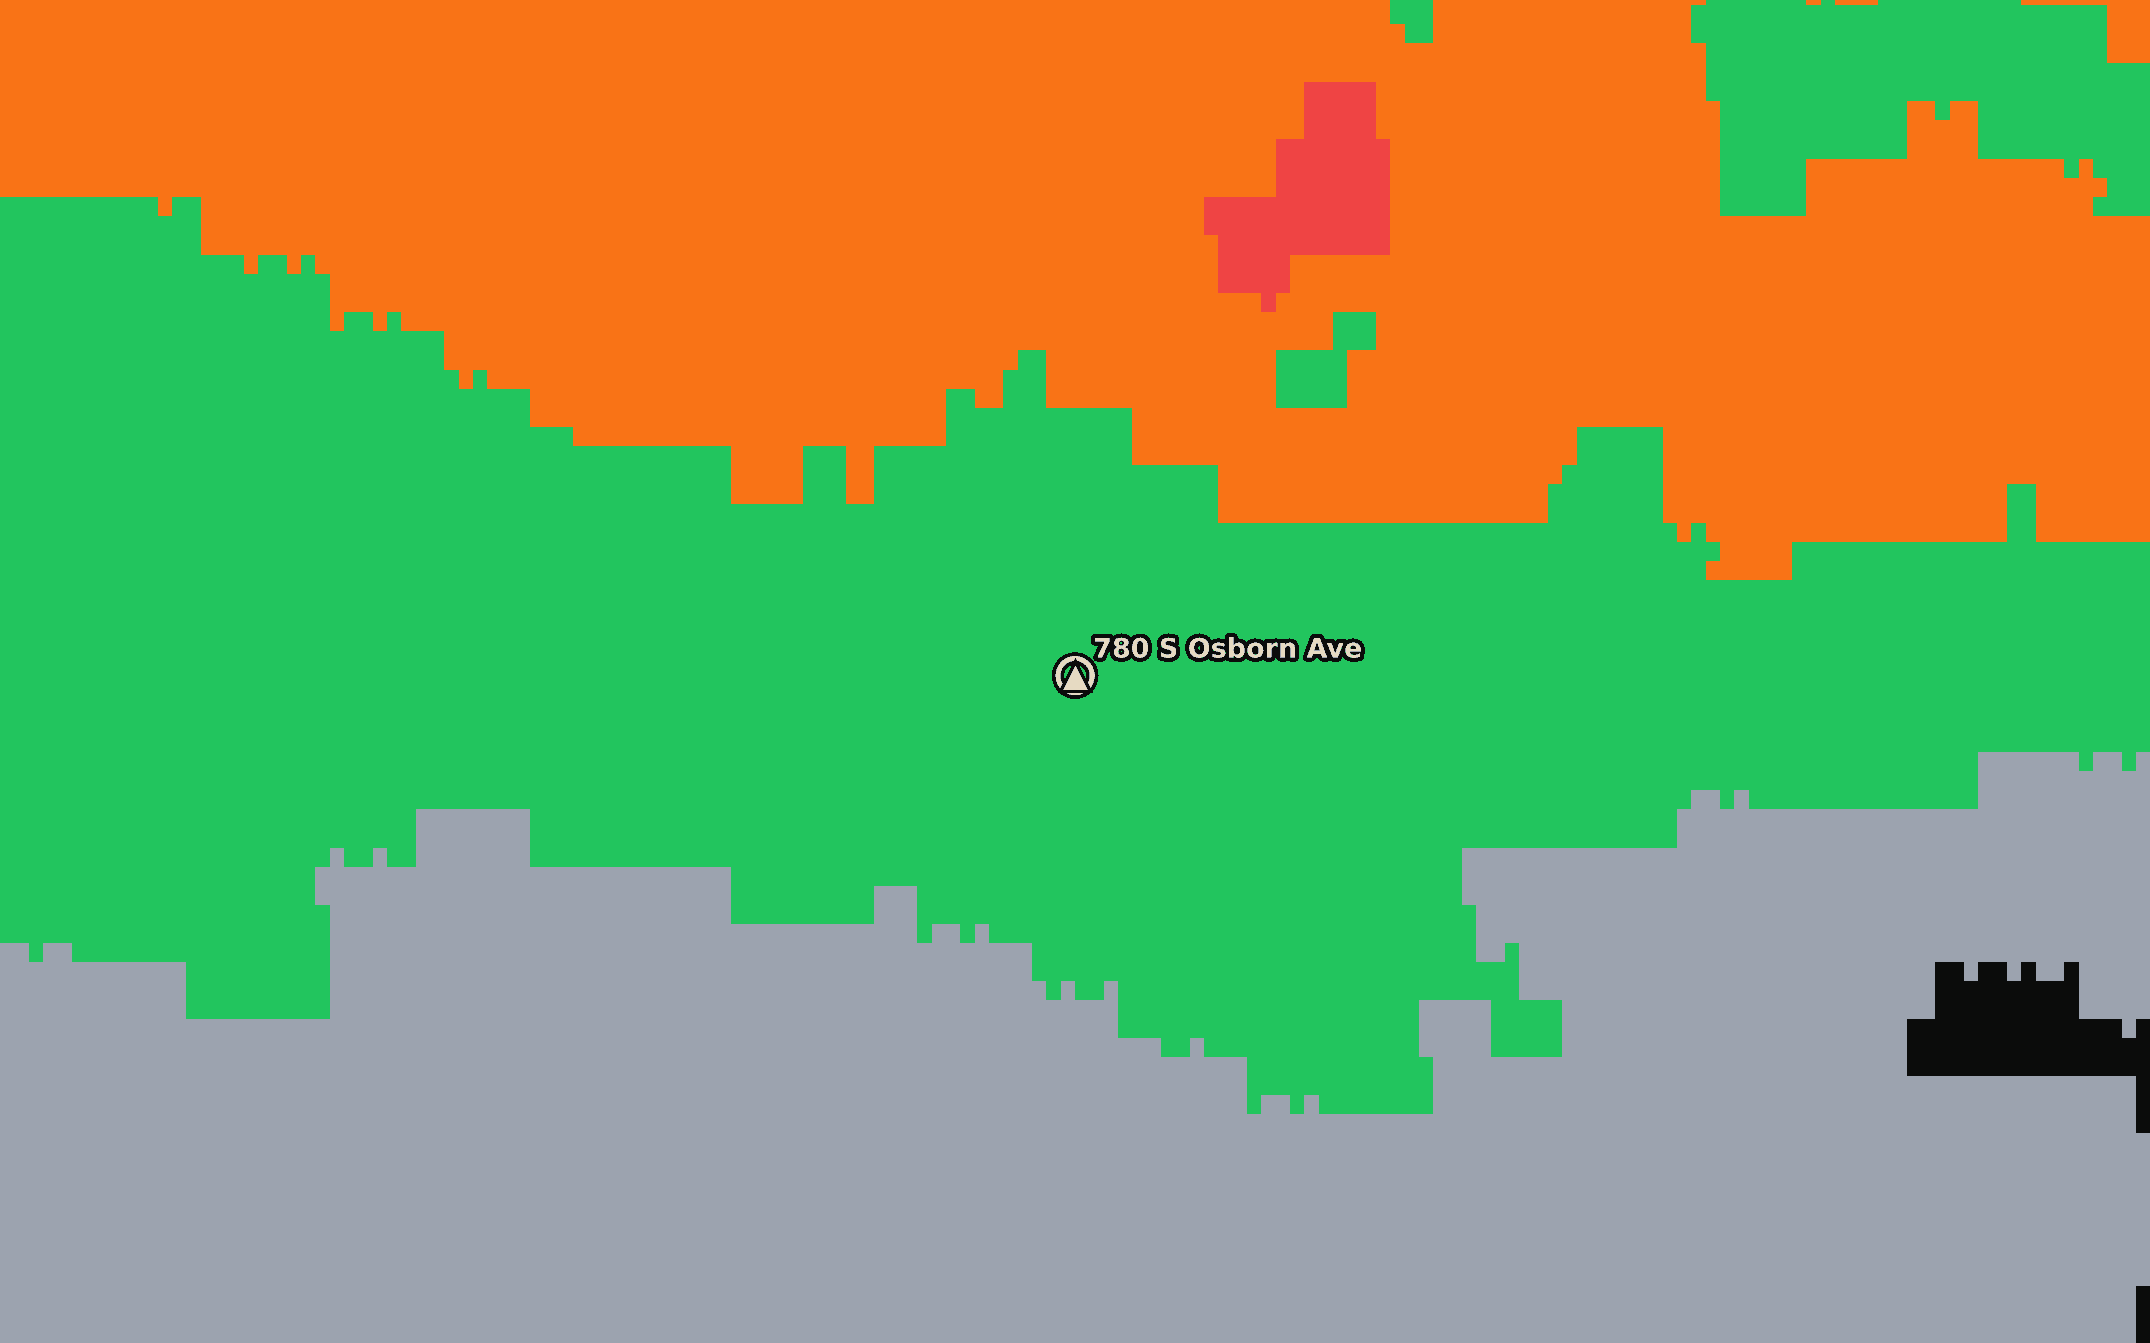
This real report reconstructs an event over a single point in Kankakee, IL, United States on 10 March 2026. It shows what the data indicates first, followed by the evidence behind that reading.
What the data shows
A direct conclusion that never presents probability as proof of damage on the ground.
Where it happened
The analysed area over the event image, with date, time and source.
How it evolved
The sequence shows when the cell arrived, how long it persisted and when it moved away.

Meteorological severity technical report · Satellite evidence
10 March 2026 · 314 ha
Claim impact
78%
of claims supported by a Skybridge report were accepted in full or in part.
41%
of initially rejected or disputed claims were reopened after the report was submitted.
12 days sooner
to receive a written decision compared with similar claims without satellite evidence.
98% agreement
between the satellite conclusion and the final determination made by the adjuster or insurer.
Illustrative results based on a target sample of 250 claims with confirmed follow-up. The report provides independent evidence but does not guarantee claim acceptance.
How it works
Three steps. One report. Ready in a day, reviewed by our team.
Search the address or mark the plot. We analyse only the area that matters.
Address or plot
Choose the day and event type. A 24-hour window is included.
24-hour window
Within a day you receive a report prepared and reviewed by our team of experts, which you can view, print and verify with a unique code.
Within a day
Pricing
One clear report for one event, date and area. No tiers or packages to understand before you begin.
Skybridge Report
One primary hazard analysed with satellites: verdict with probability, map of the area, key statistics, methodology and a verifiable code. 24 h window. Hosted for 12 months.
USD 249
per report
Events we can analyse
Hail · Lightning · Severe storms · Fire · Vegetation (NDVI)
Choose one when requesting the report. Larger areas and additional analyses are calculated before payment.
FAQ
About a day. We process the satellite data and then our team of experts reviews the report before it is published. We email you when it is ready.
Verifiable satellite report
Tell us where and when it happened. We gather the satellite evidence and issue the report.