Meteorological severity technical report · SKB-MUES-TRA1SAMPLE / MUESTRA
Case4 real cases
Contents
  1. 01 Meteorological severity technical report
  2. 02 Verdict
  3. 03 Map
  4. 04 Cloud-top temperature
  5. 05 Lightning — electrical activity over the area
  6. 06 Multispectral composition at the peak
  7. 07 Satellite evidence
  8. 08 Window summary
  9. 09 Wind
  10. 10 Radar hail
  11. 11 Storm reports
  12. 12 Statistics
  13. 13 Sources
  14. 14 Scope of this report
Skybridge Intelligence
SAMPLE / MUESTRA · SKB-MUES-TRA1

Meteorological severity technical report · Satellite evidence

Hail + Lightning · 780 S Osborn Ave

10 March 2026 · 314 ha

78%Indicators strongly consistentConfidence · Very high risk
Analysed area
Point + radius · Radius 1 km · 314 ha
Address
780 S Osborn Ave, Kankakee, IL 60901
Country
United States
Centre
41.1097, -87.8474
Event
10 March 2026
Analysed window
10/03/2026, 00:00 – 11/03/2026, 00:00 (CDT)
Event peak
03:20 UTC · 22:20 CDT
Site location

Verdict

Indicators strongly consistent

The satellite data shows indicators strongly consistent with hail and lightning over the area analysed.

The analysis covers 314 ha between 10/03/2026, 00:00 – 11/03/2026, 00:00 (CDT).

Within that window: 2 flashes · nearest at 824 m, High hail indicators (78%) and No hotspots detected.

The GLM recorded 764 flashes within 30 km of the area; 105 within 10 km and the nearest 0 m from its edge, at 22:40 UTC · 17:40 CDT. Activity within 10 km ran from 22:33 UTC · 17:33 CDT to 03:15 UTC · 22:15 CDT, peaking at 11.9 flashes per minute at 23:20 UTC · 18:20 CDT. A lightning jump was detected at 22:20 UTC · 17:20 CDT (from 0.6 to 1.3 flashes per minute), 70 min before the Band 13 minimum.

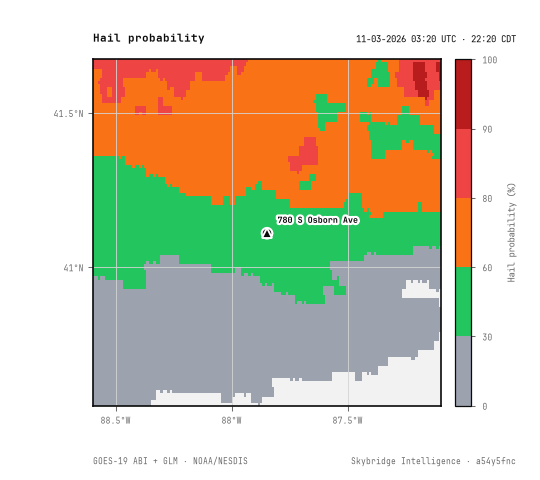
The multispectral composition developed by Skybridge shows at the peak (02:20 UTC · 21:20 CDT) a intense convective core, with an overshooting top and signs of large hail. The strongest indicator was recorded at 03:20 UTC · 22:20 CDT.

The result describes satellite-observed indicators. It does not by itself prove damage on the ground.

Confidence78%Very high risk76–100%

Signals

Band 13 min.
200 K
23:30 UTC · 18:30 CDT

Map

Map
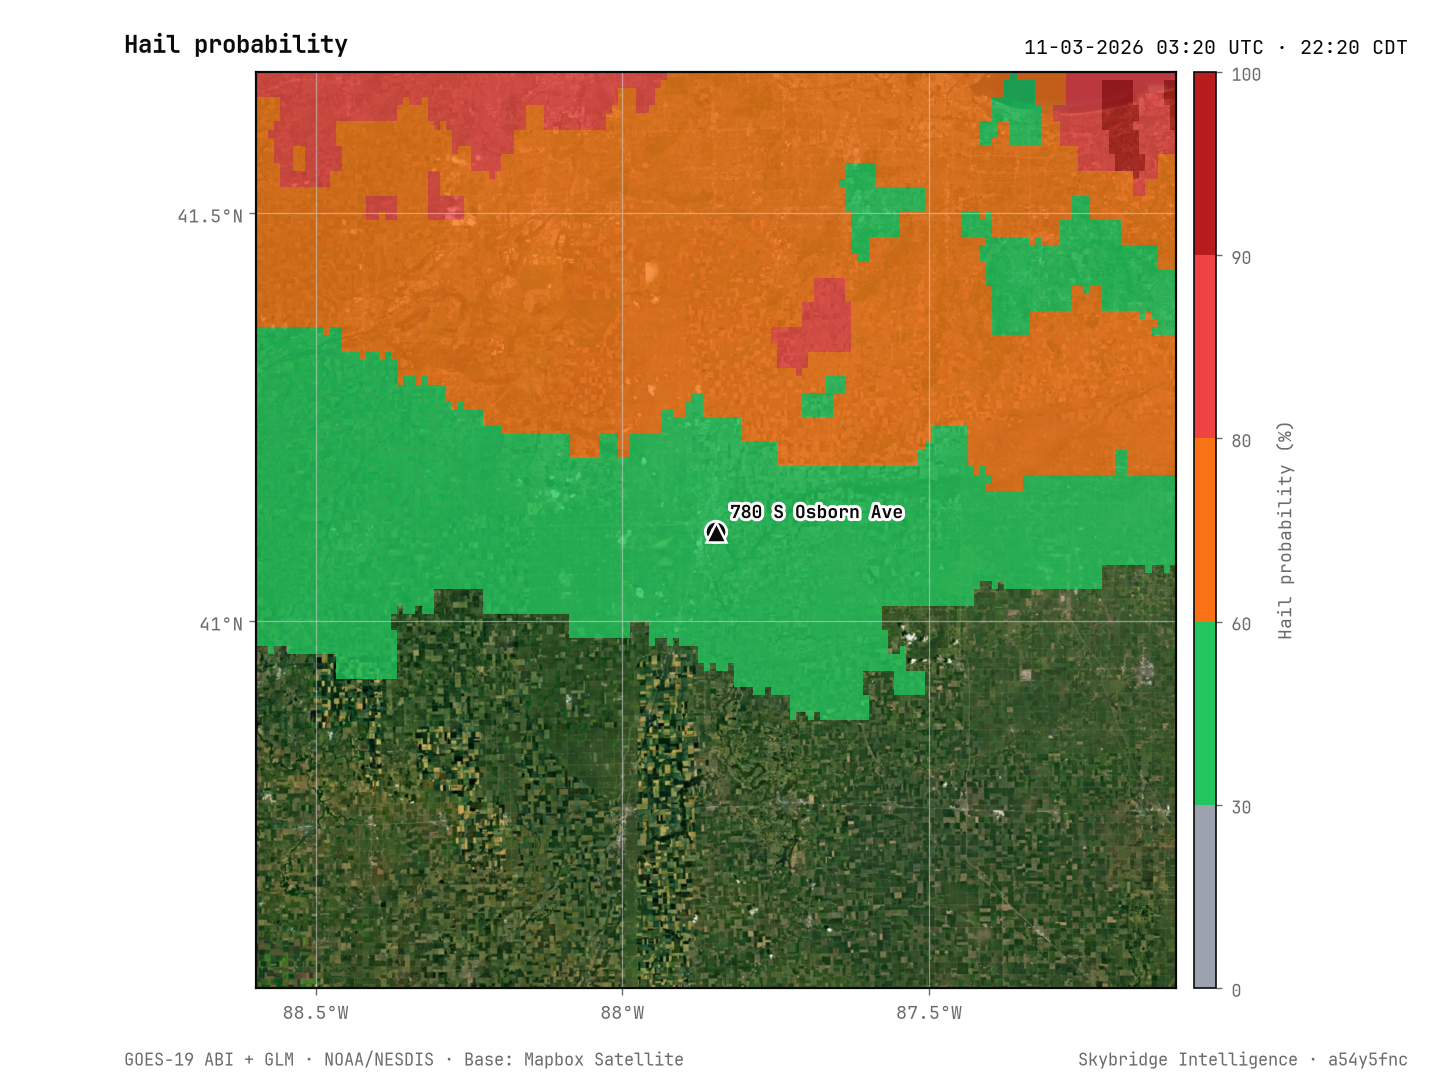
Figure 1 · MapHail probability · 03:20 UTC · 22:20 CDT · NOAA GOES-19 ABI · Mapbox Satellite1 analysis point · 2 flashes

Satellite evidence

Cloud-top temperature

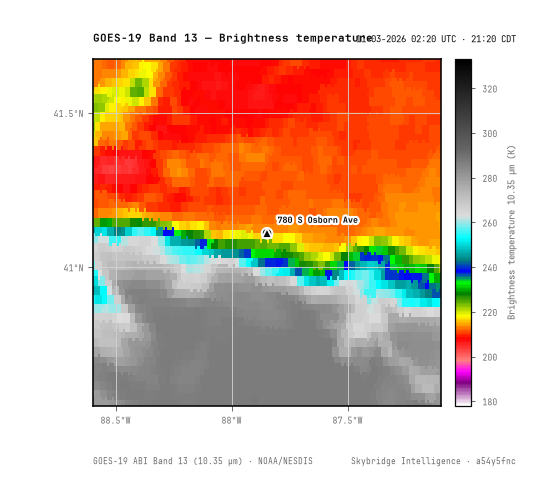
The 10.35 µm infrared channel measures cloud-top temperature: the colder the top, the higher the updraft reached and the more severe the storm over the area. It is the primary observation the other indicators are derived from.
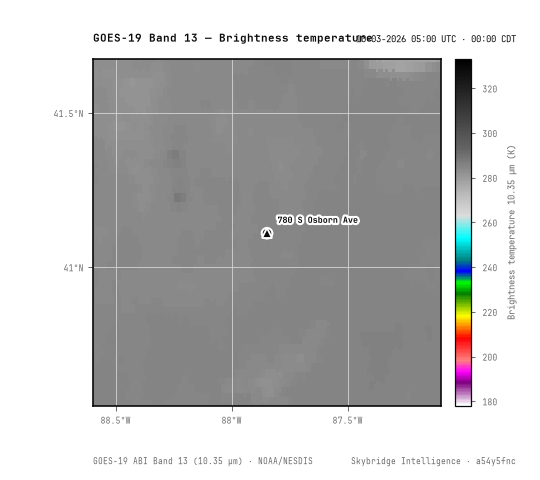
ABI Band 13 (10.3 µm) · 05:00 UTC · 00:00 CDT · NOAA GOES-19 ABI
05:00 UTC · 00:00 CDT
Min BT13 277.9 K
ABI Band 13 (10.3 µm) · 02:20 UTC · 21:20 CDT · NOAA GOES-19 ABI
02:20 UTC · 21:20 CDTPeak
Max prob. 88%Min BT13 203.4 K
Figure 2 · Cloud-top temperatureABI Band 13 (10.3 µm) · 05:00–02:20 UTC · 00:00–21:20 CDT · NOAA GOES-19 ABI2 frames · Frames every 5 minutes over the analysed area; the peak frame is marked.

Satellite evidence

Lightning — electrical activity over the area

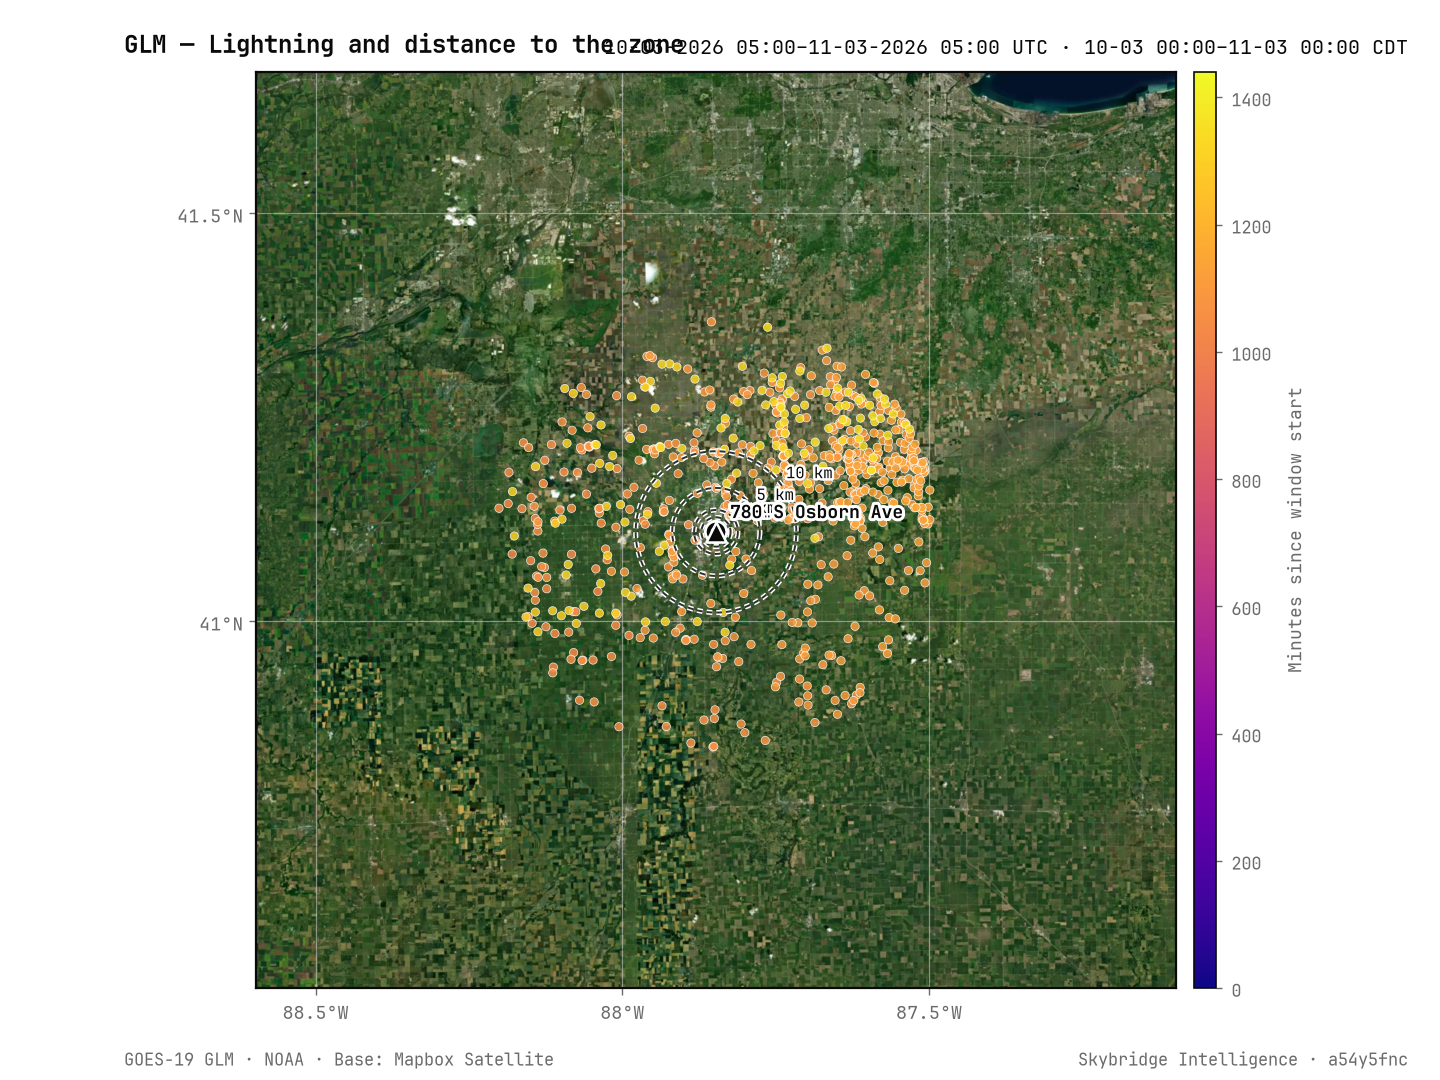
The Geostationary Lightning Mapper (GLM) detects every flash from orbit. The updraft that produces hail is the same one that separates charge: a jump in flash rate usually precedes the coldest cloud top by 5 to 20 minutes. Every flash is placed relative to the edge of the analysed area.
Lightning — electrical activity over the area
Figure 3 · GLM flashes over the window, coloured by time; rings at 1, 2, 5 and 10 km from the edge of the area.GLM flashes · flash time · 05:00–05:00 UTC · 00:00–00:00 CDT · NOAA GOES-19 GLM
Nearest to the edge of the area
0 m
22:40 UTC · 17:40 CDT
Flashes within 10 km
105
of 764 within 30 km
Peak rate
11.9
fl/min · 23:20 UTC · 18:20 CDT
Lightning jump
Yes
70 min before B13 min.

Flashes by distance to the edge of the area

RingFlashesCumulative
0 m – 1 km22
1 km – 2 km68
2 km – 5 km1624
5 km – 10 km81105
10 km – 30 km659764

Satellite evidence

Lightning — time sequence

≤ 10 km≤ 30 km0510Flashes / min

Satellite evidence

Multispectral composition at the peak

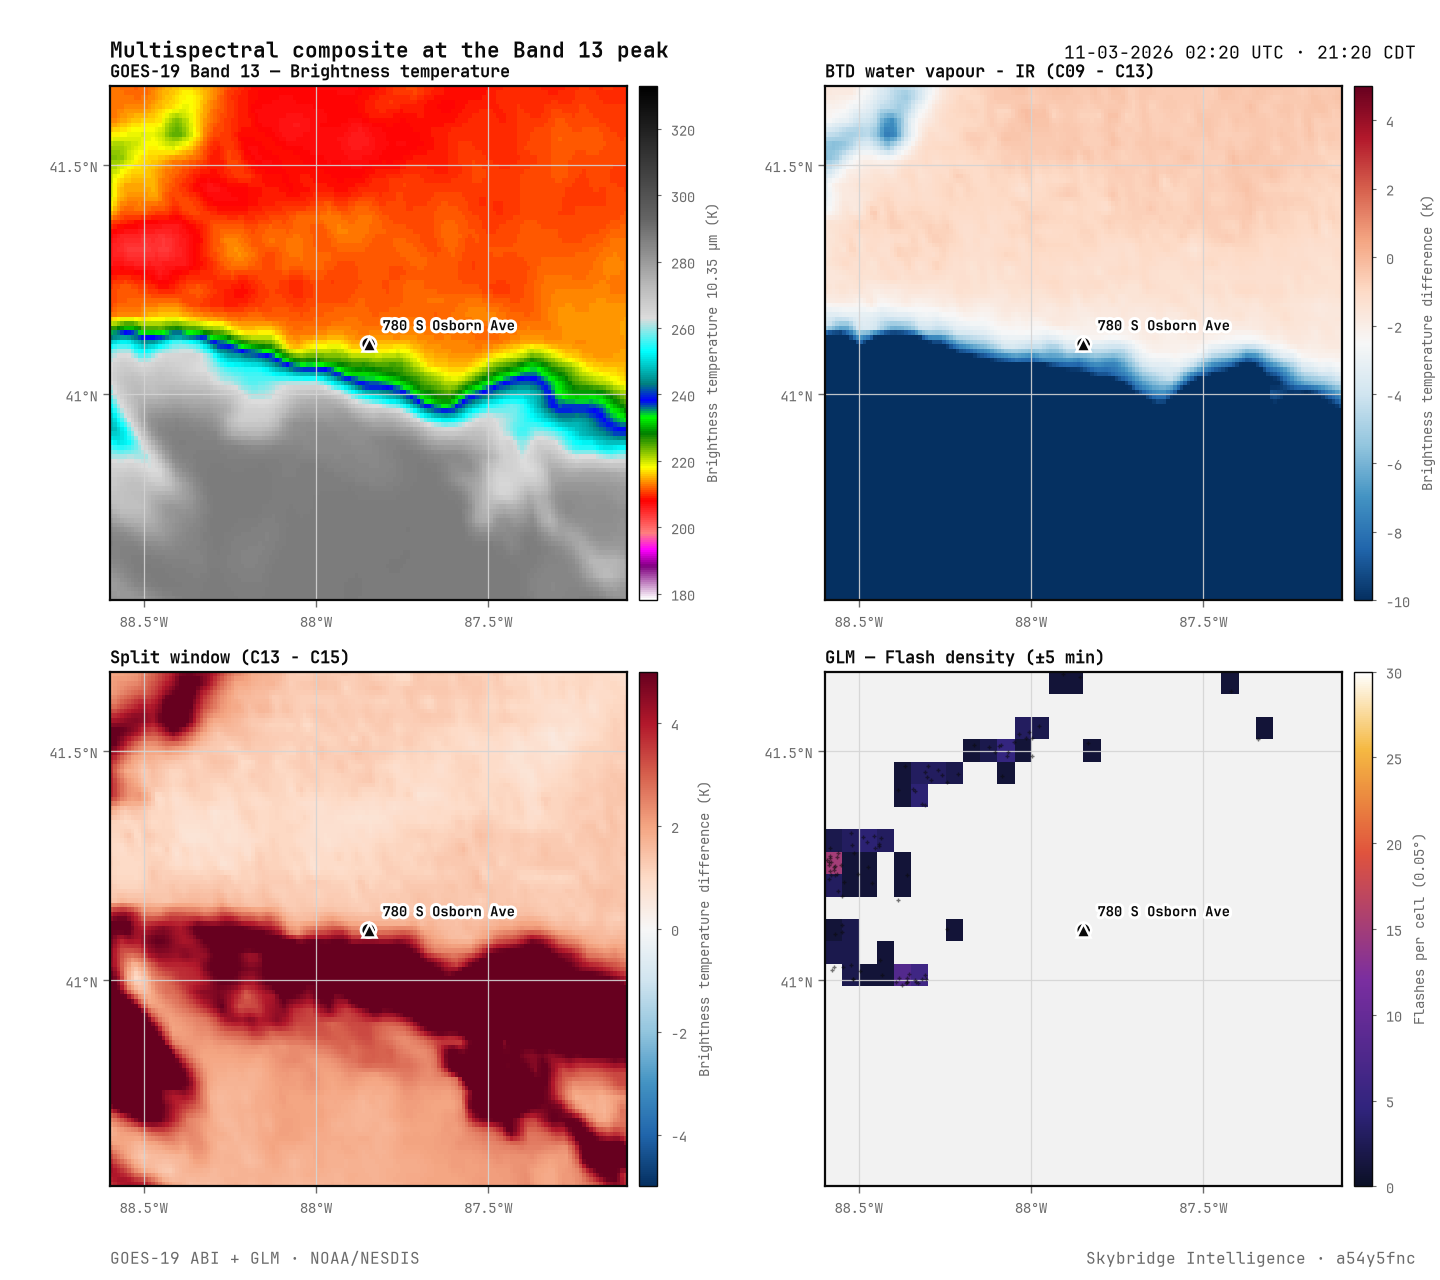
The multispectral composition developed by Skybridge shows at the peak (02:20 UTC · 21:20 CDT) a intense convective core, with an overshooting top and signs of large hail.
Multispectral composition at the peak
Figure 5 · Multispectral panel at the storm peak over the analysed area.02:20 UTC · 21:20 CDT · NOAA GOES-19 ABI · NOAA GOES-19 GLM

Satellite evidence

Hail probability · 05:00 UTC · 00:00 CDT · NOAA GOES-19 ABI
05:00 UTC · 00:00 CDT
Min BT13 277.9 K
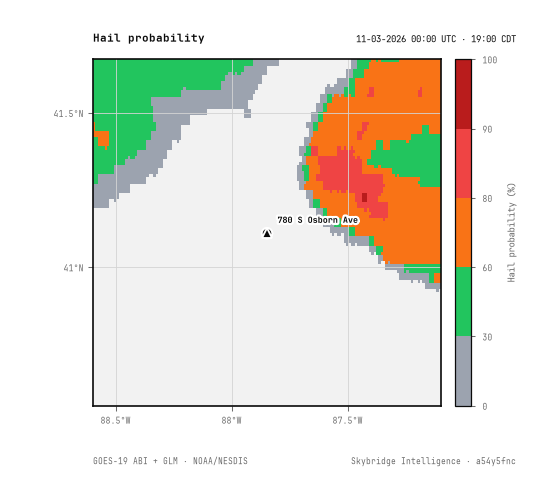
Hail probability · 00:00 UTC · 19:00 CDT · NOAA GOES-19 ABI
00:00 UTC · 19:00 CDT
Max prob. 90%
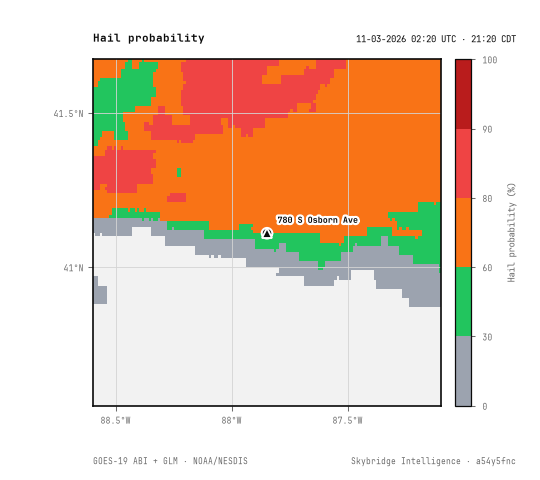
Hail probability · 02:20 UTC · 21:20 CDT · NOAA GOES-19 ABI
02:20 UTC · 21:20 CDT
Max prob. 88%Min BT13 203.4 K
Hail probability · 03:20 UTC · 22:20 CDT · NOAA GOES-19 ABI
03:20 UTC · 22:20 CDTPeak
Max prob. 95%
Figure 6 · Satellite sequenceHail probability · 05:00–03:20 UTC · 00:00–22:20 CDT · NOAA GOES-19 ABI4 frames · Frames every 5 minutes over the analysed area; the peak frame is marked.

Window summary

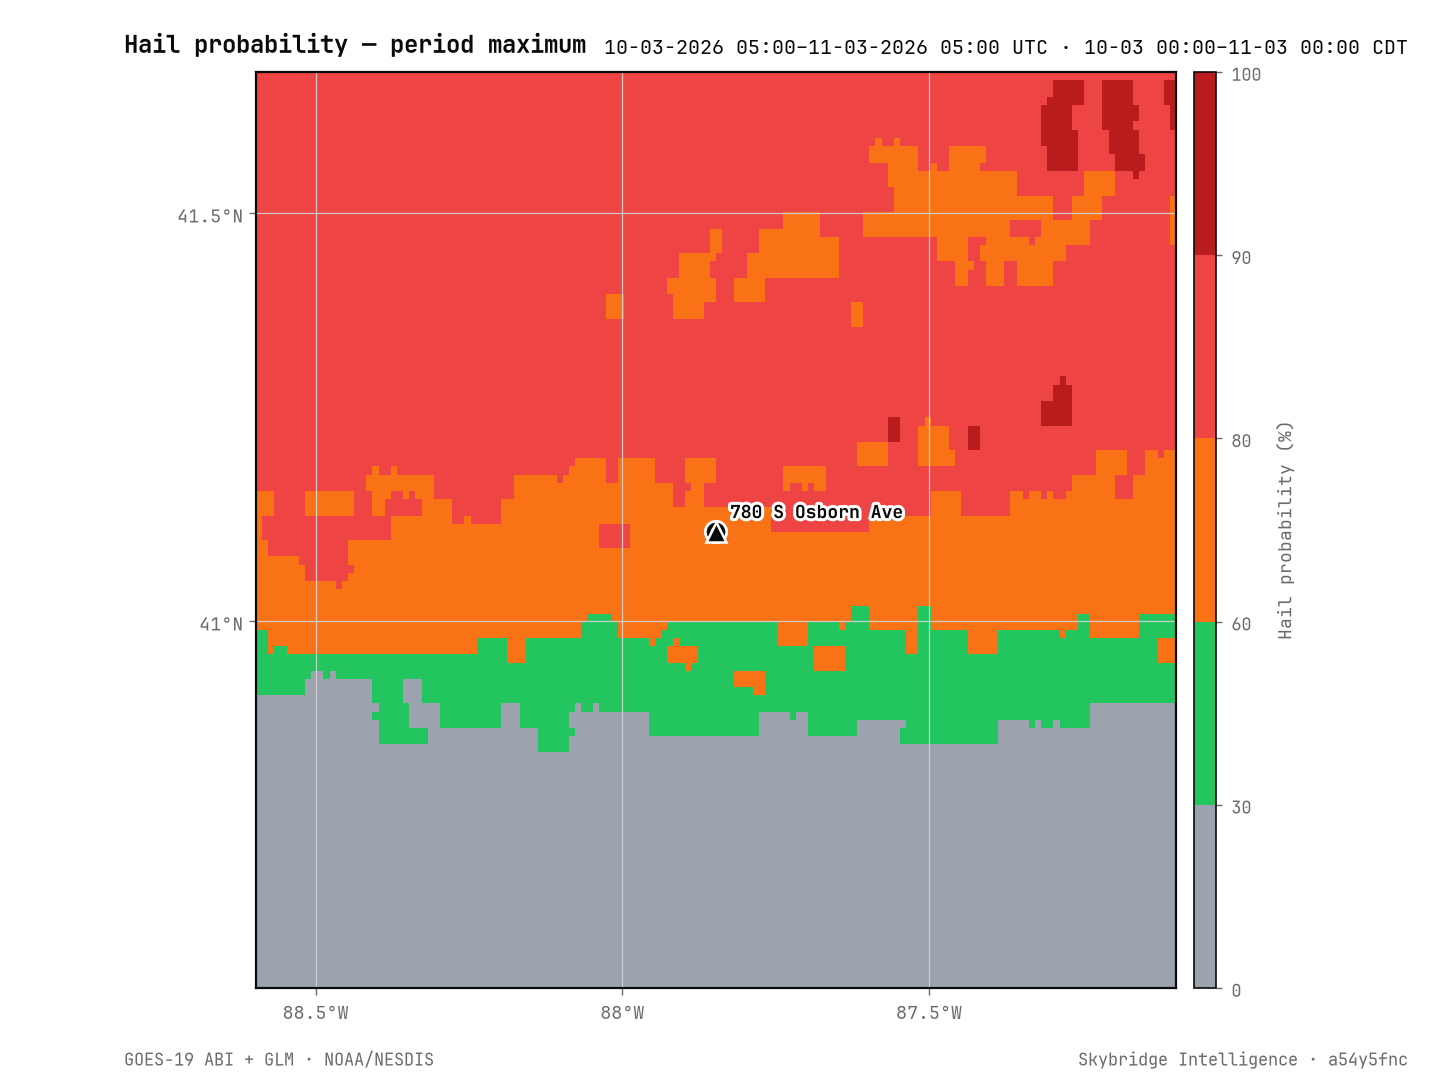
Maximum hail probability over the window
Figure 7 · Maximum hail probability over the windowHail probability · 05:00–05:00 UTC · 00:00–00:00 CDT · NOAA GOES-19 ABI
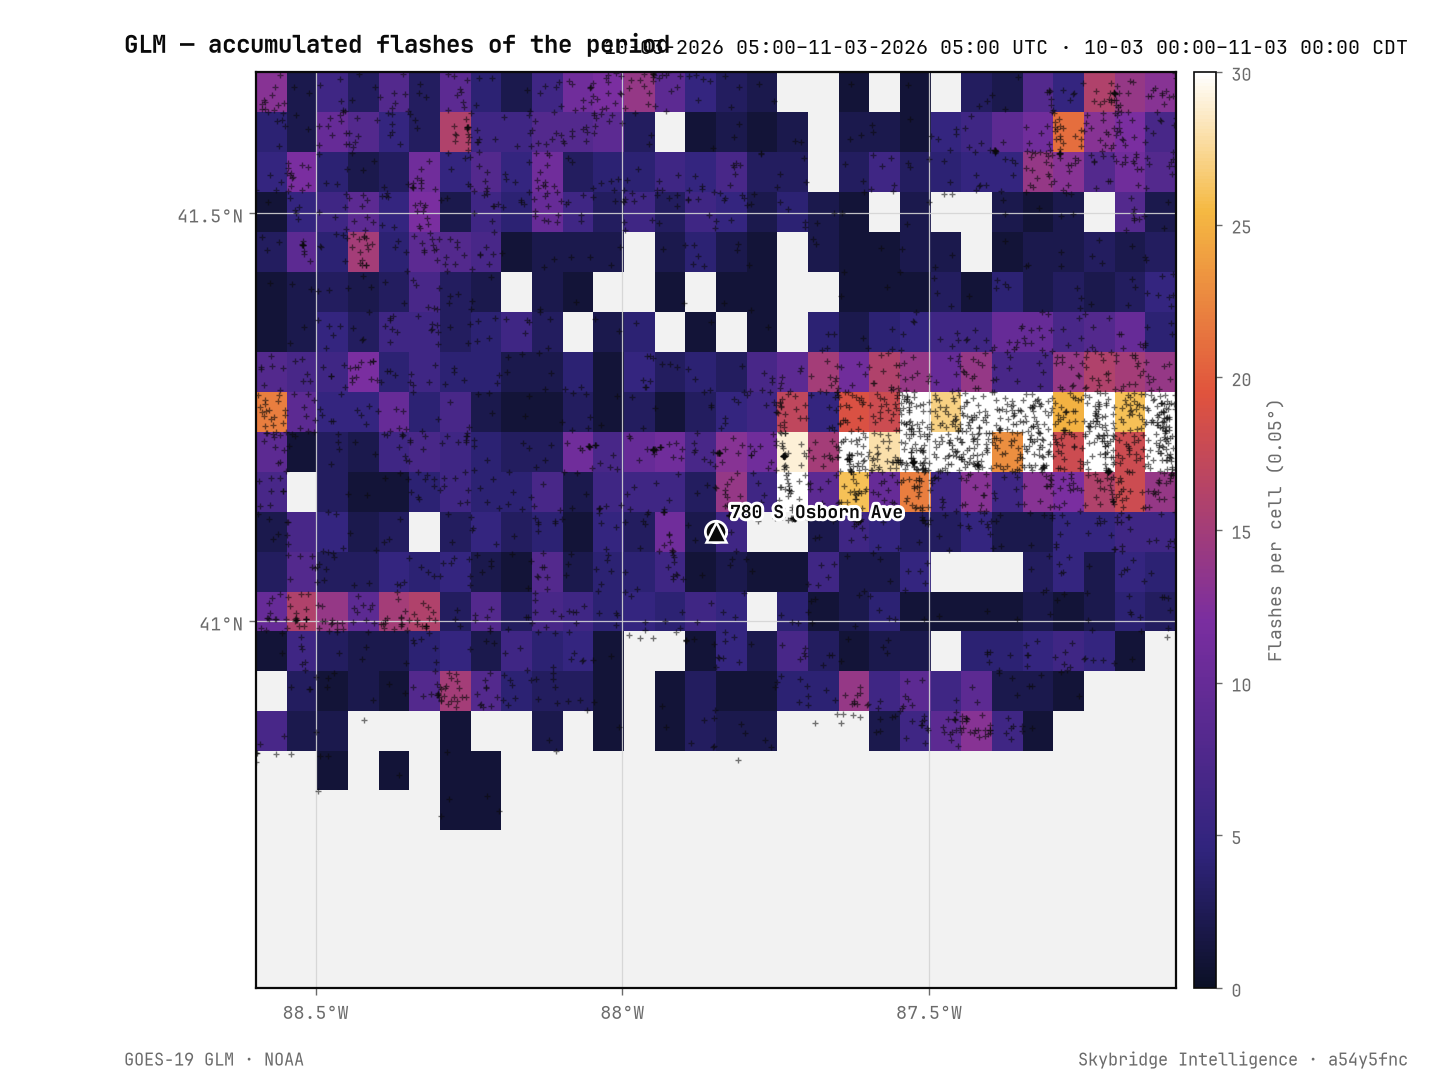
Accumulated GLM flash density over the window
Figure 8 · Accumulated GLM flash density over the windowGLM flash density · 05:00–05:00 UTC · 00:00–00:00 CDT · NOAA GOES-19 GLM

Satellite evidence

Surface wind — direction and intensity

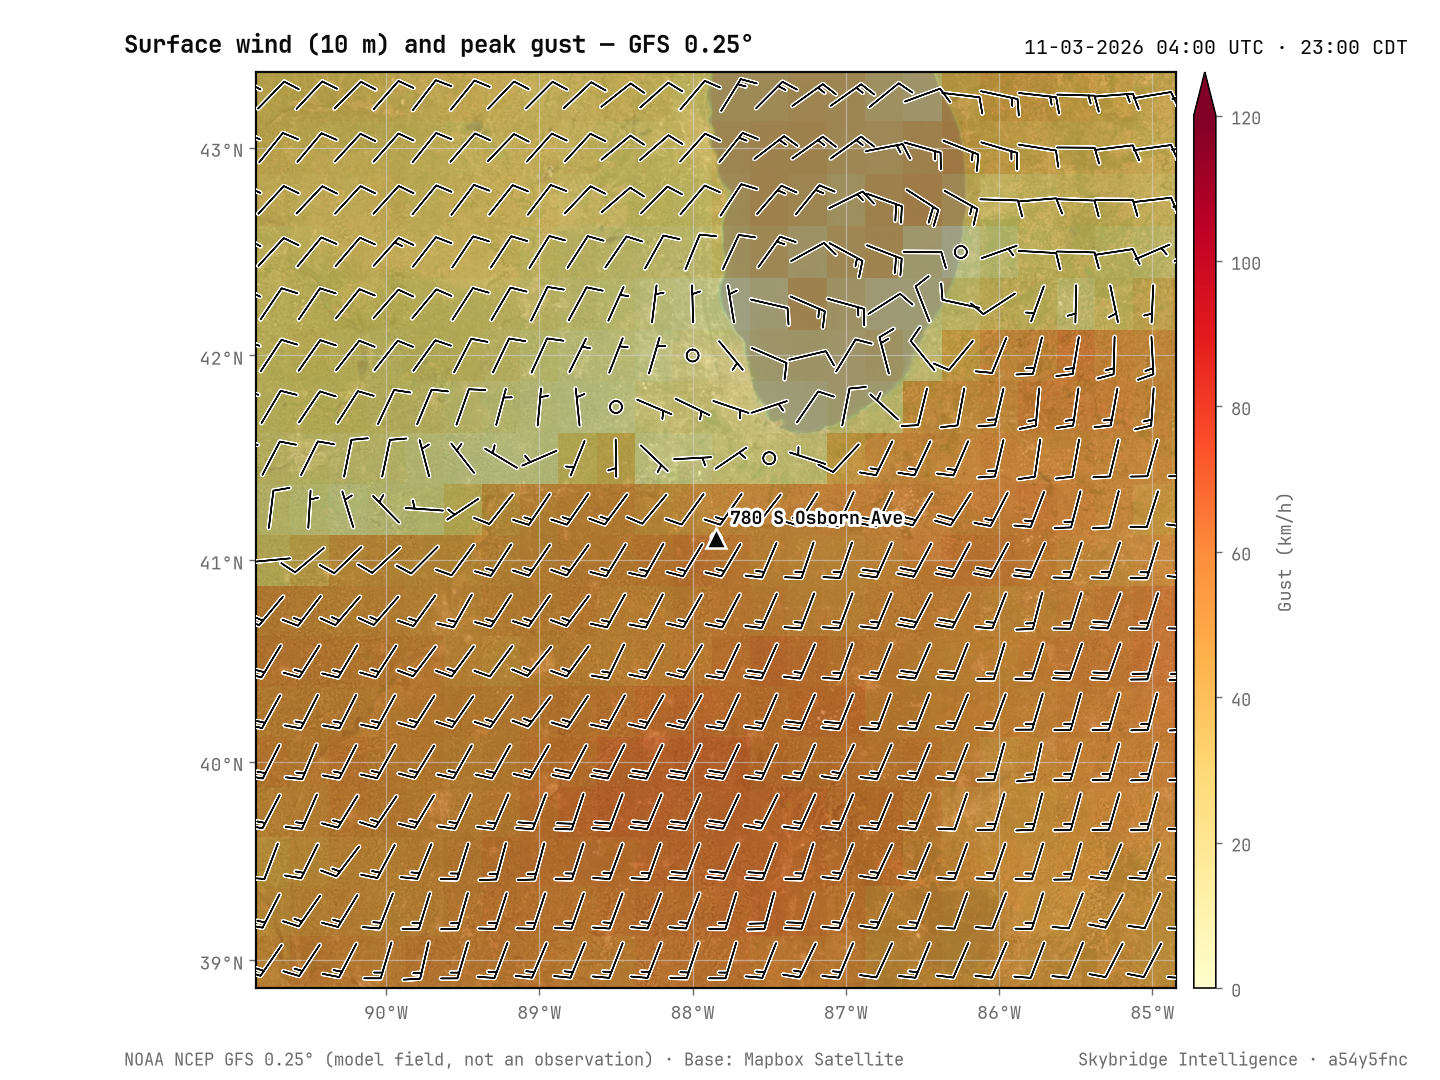
The satellite does not measure surface wind, so the wind is read from NCEP’s global GFS model (NOAA) at 0.25°: mean 10 m wind and surface gust, hour by hour, at the grid node nearest the site. It is a model field, not a measurement: it describes the synoptic wind over the area, and a local convective gust can exceed it.
Surface wind — direction and intensity
Figure 9 · 10 m wind (barbs, knots) and peak gust (colour, km/h) at the hour of the strongest gust over the site; the triangle marks the analysed area.10 m wind and gust (GFS 0.25°) · 04:00 UTC · 23:00 CDT · NOAA NCEP GFS 0.25°
Peak gust
62 km/h
04:00 UTC · 23:00 CDT · from 211° SSW
Peak mean wind
30 km/h
02:00 UTC · 21:00 CDT · from 193° SSW
Prevailing direction
197° SSW
mean 21 km/h
Intensity
Intense
2 h with gusts ≥ 60 km/h
Mean wind (10 m)GustDirection

Independent sources

Radar-estimated hail — NOAA MRMS

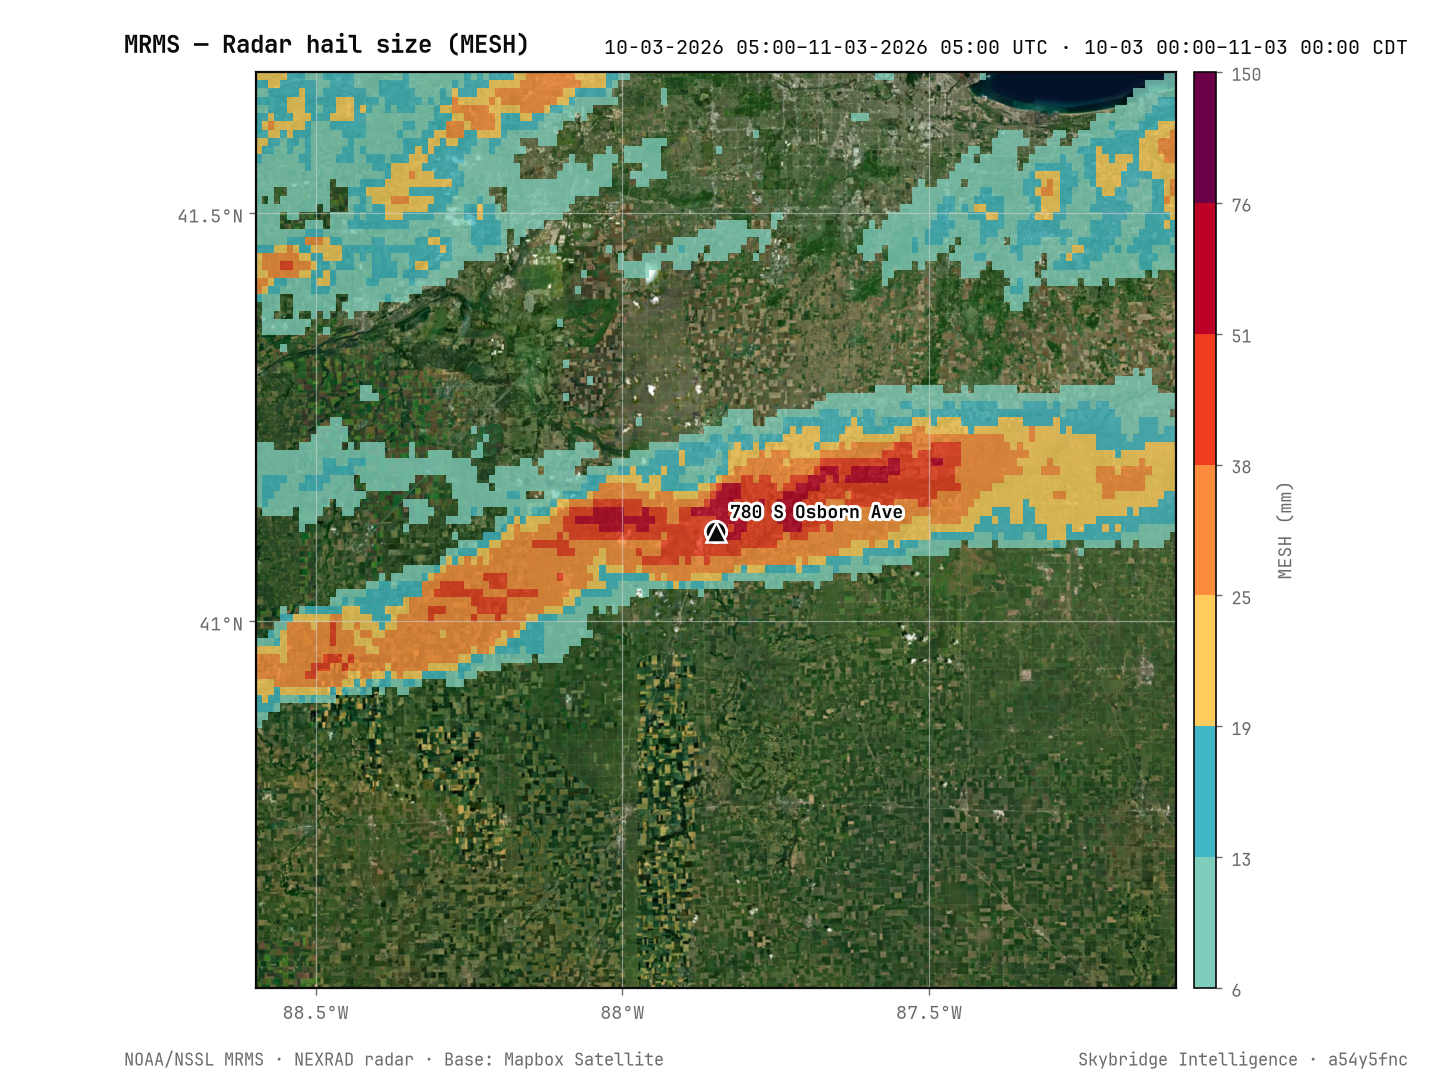
NOAA’s MRMS (Multi-Radar Multi-Sensor) system combines the US weather-radar network and estimates, hour by hour, the maximum expected hail size (MESH, Maximum Estimated Size of Hail) on a ~1 km grid. It is a source independent of the satellite: a radar-derived estimate, not a measurement of the hail that fell on the property.
Radar-estimated hail — NOAA MRMS
Figure 11 · Maximum estimated hail size (MESH) over the window, each cell’s maximum across all hours; the analysed area is outlined.MESH (MRMS) · 05:00–05:00 UTC · 00:00–00:00 CDT · NOAA/NSSL MRMS
Max MESH over the area
55 mm
2.15 in · giant hail
Max MESH within 5 km
59 mm
2.32 in
Max MESH within 10 km
63 mm
2.47 in
Hour of highest MESH
19:00 CDT
00:00 UTC

Radar estimates hail up to 55 mm (2.15 in) over the analysed area (giant hail); the maximum within 5 km of the site is 59 mm (2.32 in) and within 10 km, 63 mm (2.47 in). The highest MESH over the area falls in the hour ending at 00:00 UTC · 19:00 CDT.

MESH is a radar-derived estimate over ~1 km cells, not a measurement at the property: the hail that fell at a given spot may be smaller or larger.

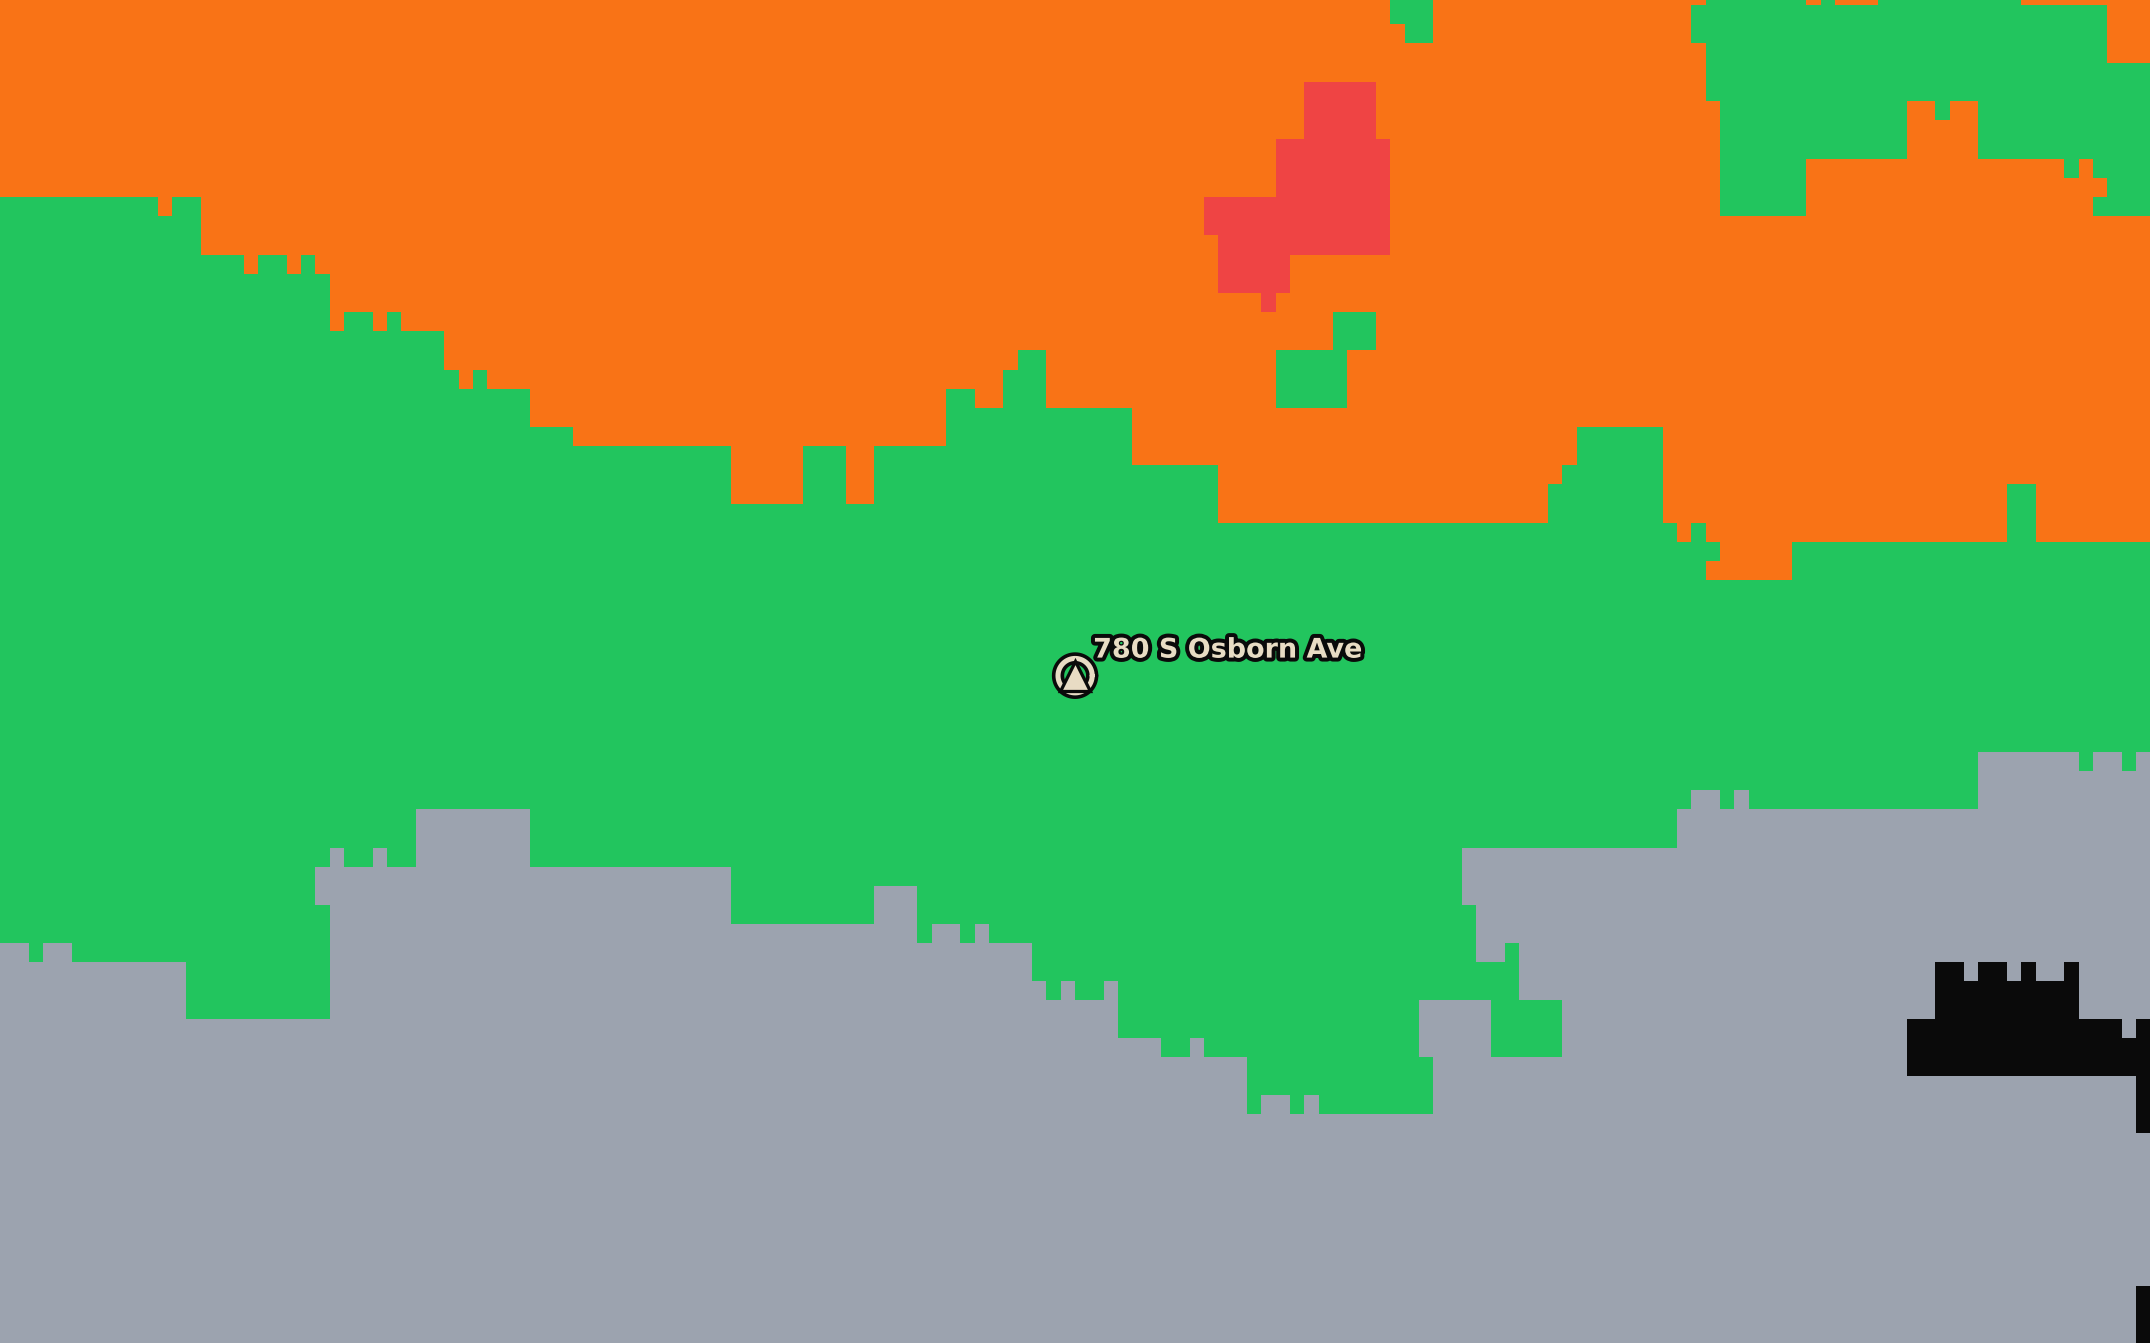
Source: NOAA/NSSL MRMS, product MESH_Max_60min_00.50, ~1 km grid; 24 hours read, 0 missing. Classes: small ≥ 6 mm, large ≥ 19 mm, severe ≥ 25 mm (1 in), giant ≥ 51 mm (2 in).

Independent sources

Ground storm reports — NOAA SPC

The US National Weather Service’s Storm Prediction Center (SPC) publishes, every day, the hail, wind and tornado reports it receives from trained spotters, emergency services and the public. They are preliminary: they may contain duplicates or errors in time and location, and the absence of reports does not show that no hail fell.

Reports within 50 km
46
35 hail · 5 wind · 6 tornado
Largest reported hail
6.1 in
155 mm
Nearest hail report
200 m
Strongest reported wind
—

Reports nearest the site

TypeTimeDistanceMagnitudePlace
Hail23:28 UTC · 18:28 CDT200 m6.1 in (155 mm)1 SSE Kankakee, Kankakee, IL
Hail23:30 UTC · 18:30 CDT600 m6 in (152 mm)1 SE Kankakee, Kankakee, IL
Hail23:31 UTC · 18:31 CDT1.1 km4 in (102 mm)1 SE Kankakee, Kankakee, IL
Hail23:32 UTC · 18:32 CDT1.6 km3 in (76 mm)Kankakee, Kankakee, IL
Hail23:11 UTC · 18:11 CDT2.5 km4.5 in (114 mm)1 NNE Kankakee, Kankakee, IL
Hail23:35 UTC · 18:35 CDT2.5 km4.1 in (104 mm)1 NW Aroma Park, Kankakee, IL
Hail23:27 UTC · 18:27 CDT2.9 km2.75 in (70 mm)2 S Kankakee, Kankakee, IL

Statistics

Flashes
2
Max energy
2.58e-13
J
High/Severe
1
Low/Moderate
1
Max hail prob.
78%
Min cloud top
-75 °C
197.7 K
Days with risk
2
Map coverage
66.1%
Hotspots
High confidence
Max FRP
—
Sources
—

Sources

Hail / Severe storms. NOAA GOES-19 ABI (Advanced Baseline Imager), infrared imagery every 5 minutes over the window and the multispectral composition at the peak.

Lightning. NOAA GOES-19 GLM (Geostationary Lightning Mapper), flashes with position and time; distances are measured to the edge of the area.

Fire. NASA FIRMS VIIRS (S-NPP / NOAA-20 / NOAA-21), active-fire detections.

Vegetation (NDVI). Copernicus Sentinel-2, imagery before and after the event.

Surface wind. NOAA NCEP GFS 0.25° (global model), hourly surface wind and gust at the grid node nearest the site. A model field, not a station observation: the satellite does not measure surface wind.

Radar hail. NOAA/NSSL MRMS (Multi-Radar Multi-Sensor), hail size estimated from the US weather-radar network, hour by hour over the area. A radar estimate, not a measurement at the property.

Ground reports. NOAA/NWS Storm Prediction Center, preliminary hail, wind and tornado reports within 50 km of the site over the window; they come from observers and may carry time or location errors.

All sources are public and are used without altering their values. The evaluation method that turns them into a verdict is Skybridge’s own; what the report does and does not establish is set out in the next section.

Figures are rendered from the same rasters used for the verdict, on the analysis extent, with the AOI outlined; times are shown in UTC and CDT (UTC−5).

Scope of this report

Automatically generated from public satellite data (NOAA GOES-19 ABI/GLM, NASA VIIRS, Copernicus Sentinel-2). It characterises the severity of satellite indicators over the stated area and window; it does not replace an on-site inspection nor constitutes an expert opinion on its own.
Skybridge Intelligence · skybridge-intel.comCode SKB-MUES-TRA1 · Sample
Site location · Mapbox Satellite
SiteUnited States
Location in the country · United States
Hail probability · 03:20 UTC · 22:20 CDT · NOAA GOES-19 ABI
Cover · Hail probability · 03:20 UTC · 22:20 CDT · NOAA GOES-19 ABI
Issued on 1 October 2026 at 05:04Edition Skybridge ReportRequested by SampleSample report: a real report of a real event in Kankakee, IL, United States on 10 March 2026. The requester’s details have been withheld.
Access code
SKB-MUES-TRA1
Verify this report at www.skybridge-intel.com/en/verify
Nearest flash
0 m
22:40 UTC · 17:40 CDT
Multispectral composition
Intense
02:20 UTC · 21:20 CDT
Overshooting top
Detected
Peak gust (GFS)
62 km/h
04:00 UTC · 23:00 CDT · SSW
MESH (MRMS)
55 mm
2.15 in · 00:00 UTC · 19:00 CDT

Indicators analysed

Lightning
2 flashes · nearest at 824 m
7%
Hail
High hail indicators (78%)
78%
Fire
No hotspots detected
0%
Low risk 0–25%Moderate risk 26–50%High risk 51–75%Very high risk 76–100%

Summary

Analysed areaPoint + radius · Radius 1 km
Area314 ha
Event10 March 2026
Analysed window10/03/2026, 00:00 – 11/03/2026, 00:00 (CDT)
Included analysesHail, Lightning
Access codeSKB-MUES-TRA1
223213203Band 13 min. (K)08:0003:0012:0007:0016:0011:0020:0015:0000:0019:0004:0023:00UTCCDTJumpB13 min.Δ −70 min
Figure 4 · GLM flash rate in 10-min bins (bars: within 10 km; line: within 30 km) and minimum cloud-top temperature (Band 13) on the same time axis.NOAA GOES-19 GLM · NOAA GOES-19 ABI

Nearest flashes

TimeDistanceEnergyPosition
22:40 UTC · 17:40 CDT0 m258 fJ41.1008, -87.8455
22:41 UTC · 17:41 CDT0 m115 fJ41.1156, -87.8415
22:43 UTC · 17:43 CDT1 km6.3 fJ41.1102, -87.8235
23:09 UTC · 18:09 CDT1.8 km3.3 fJ41.1295, -87.8264
23:01 UTC · 18:01 CDT1.9 km4.3 fJ41.1308, -87.8267
23:44 UTC · 18:44 CDT1.9 km4.3 fJ41.1292, -87.8237
23:18 UTC · 18:18 CDT2 km30 fJ41.1306, -87.8255
23:08 UTC · 18:08 CDT2 km6.3 fJ41.1311, -87.8262
22:47 UTC · 17:47 CDT2.1 km570 fJ41.0997, -87.8817
23:09 UTC · 18:09 CDT2.5 km26 fJ41.1351, -87.8218

Distances are measured to the edge of the area; the GLM footprint is ~8 km, so distances below 2 km are indicative.

020406080km/hIntense threshold · 60 km/hPeak gust 62 km/h08:0003:0012:0007:0016:0011:0020:0015:0000:0019:0004:0023:00UTCCDT
Figure 10 · Gust and mean 10 m wind hour by hour over the site, with direction (arrows: where it blows to) and the intense-wind threshold.NOAA NCEP GFS 0.25°

Source: NOAA NCEP GFS 0.25° (analysis and short-range forecast of each cycle), 25 hourly fields read, 0 missing. Thresholds: intense wind at gusts ≥ 60 km/h or mean wind ≥ 40 km/h; severe at gusts ≥ 90 km/h or mean wind ≥ 60 km/h. A 0.25° cell is about 25 km wide: a storm’s gusts over one field can exceed the model value.

Wind
23:30 UTC · 18:30 CDT
3.2 km
n/a
1 WNW Aroma Park, Kankakee, IL
Tornado23:27 UTC · 18:27 CDT3.3 kmn/a1 N Kankakee Airport, Kankakee, IL
Hail23:20 UTC · 18:20 CDT3.5 km2 in (51 mm)Bradley, Kankakee, IL
Hail23:25 UTC · 18:25 CDT3.6 km4 in (102 mm)2 WSW Kankakee, Kankakee, IL

Source: NOAA/NWS Storm Prediction Center, preliminary reports (convective days 09/03/2026, 10/03/2026, 12 to 12 UTC). Distances are measured from the centre of the site. Hail is reported in inches and wind in miles per hour; the metric equivalent is given in brackets.